R ggplot2包能够绘制各种类型的图表,但保存这些图表同样重要。要保存图表,我们可以使用传统方法(通过导出选项)或ggplot2包提供的ggsave函数。下面我们将通过一个示例,介绍如何使用R的ggsave函数和导出选项来保存ggplot绘制的图表。
在编程中保存ggsave的语法是
ggsave(filename)
其背后的复杂语法是
ggsave(filename, plot = last_plot(), device = NULL, path = NULL,
       scale = 1, width = NA, height = NA, dpi = 300, limitsize = TRUE, ..,
       units = c("in", "cm", "mm"))
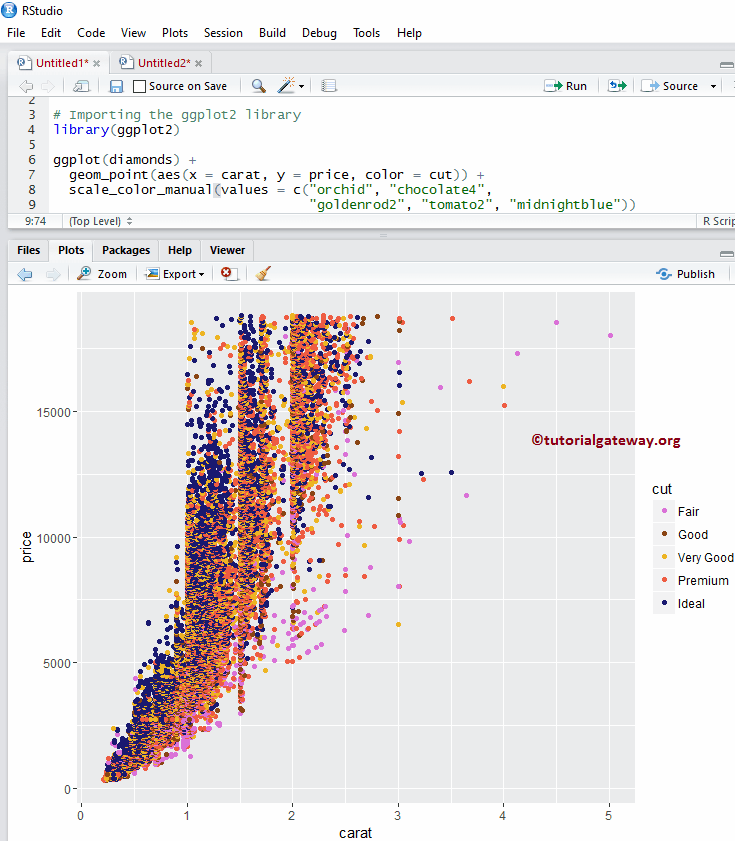
创建R ggplot散点图
在此示例中,我们绘制一个散点图,并打算保存它。我建议您参考ggplot2散点图文章以了解如何绘制散点图。
提示:ggplot2包并非默认安装。请参考安装R包文章来安装R编程包。
# Importing the ggplot2 library
library(ggplot2)

ggplot(diamonds) +
  geom_point(aes(x = carat, y = price, color = cut)) +
  scale_color_manual(values = c("orchid", "chocolate4",
                                "goldenrod2", "tomato2", "midnightblue"))
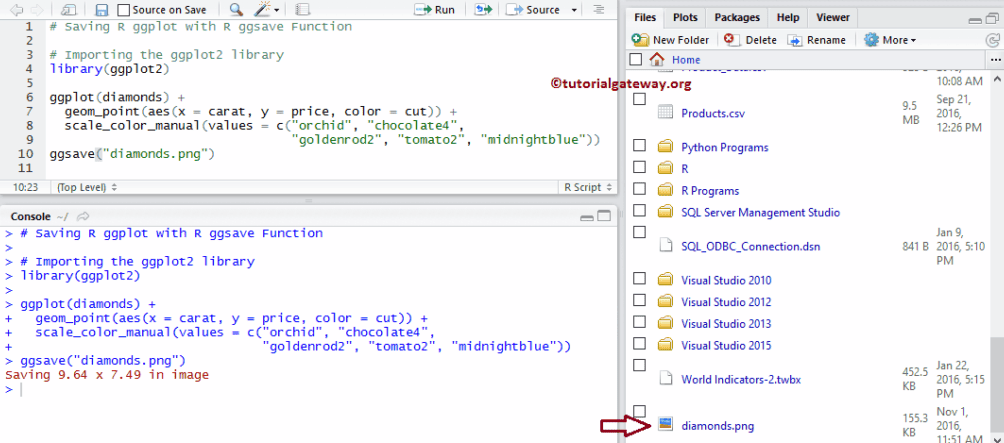
使用ggsave将R ggplot保存为PNG
让我们看看如何使用ggplot2的ggsave函数将ggplot图表保存为png图像。
# Importing the library
library(ggplot2)

ggplot(diamonds) +
  geom_point(aes(x = carat, y = price, color = cut)) +
  scale_color_manual(values = c("orchid", "chocolate4",
                                "goldenrod2", "tomato2", "midnightblue"))
# To save as png
ggsave("diamonds.png")
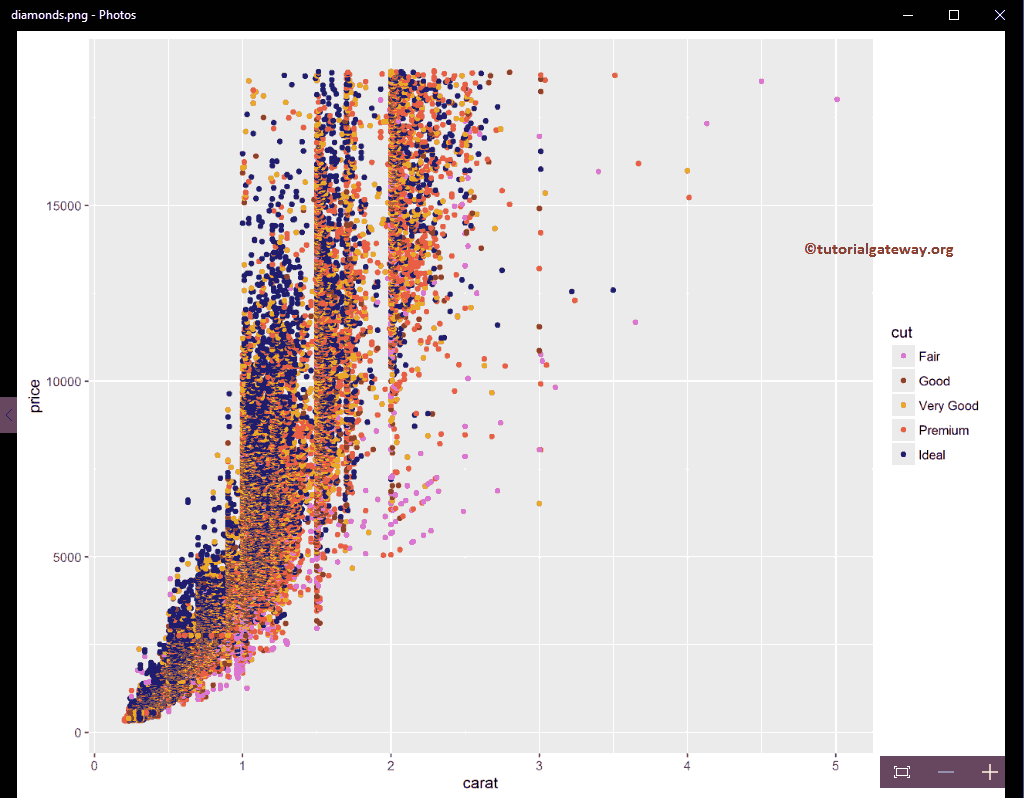
让我们打开diamonds.png文件看看
使用ggsave将R ggplot保存为JPEG
在此示例中,我们将展示如何使用ggplot2的ggsave函数将ggplot图表保存为jpeg图像。
# Importing the library
library(ggplot2)

ggplot(diamonds) +
  geom_point(aes(x = carat, y = price, color = cut)) +
  scale_color_manual(values = c("orchid", "chocolate4",
                                "goldenrod2", "tomato2", "midnightblue"))
# saving the scatterplot as jpeg
ggsave("diamonds2.jpeg")
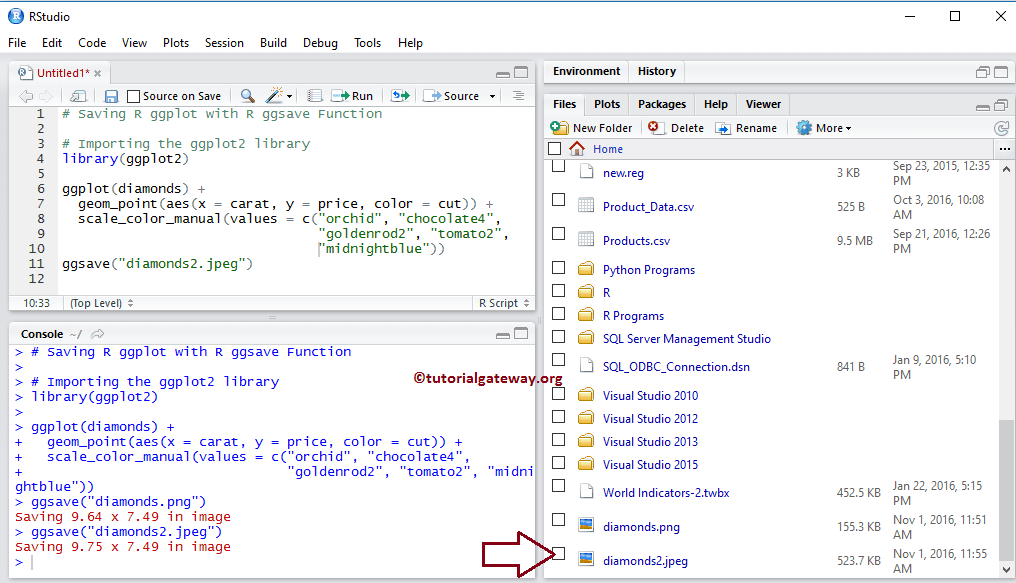
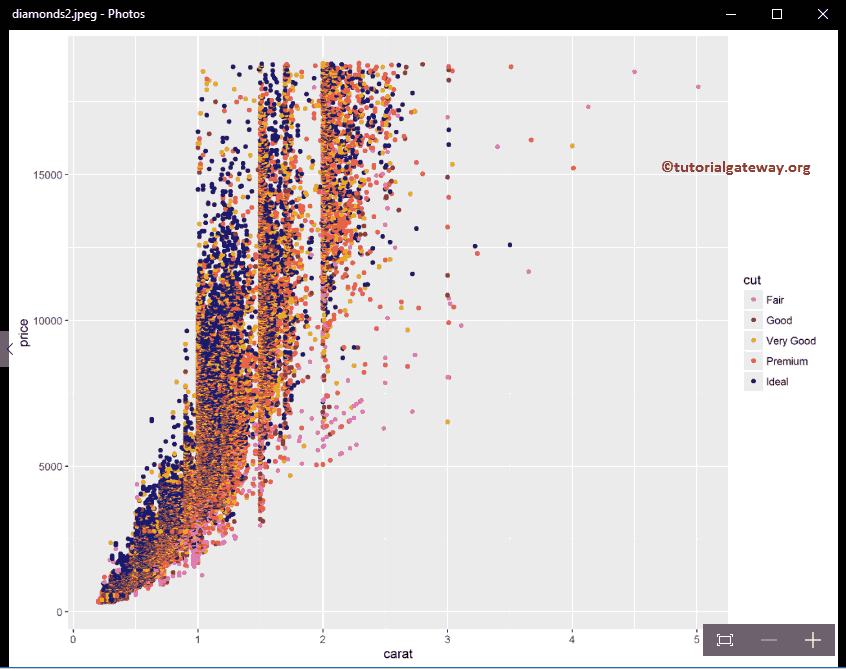
让我们打开diamonds2.jpeg文件看看
使用ggsave将R ggplot保存为PDF
此示例展示了如何使用ggplot2的ggsave函数将ggplot图表保存为pdf文件。
# Importing the library
library(ggplot2)

ggplot(diamonds) +
  geom_point(aes(x = carat, y = price, color = cut)) +
  scale_color_manual(values = c("orchid", "chocolate4",
                                "goldenrod2", "tomato2", "midnightblue"))
# Saving as pdf
ggsave("diamonds3.pdf")
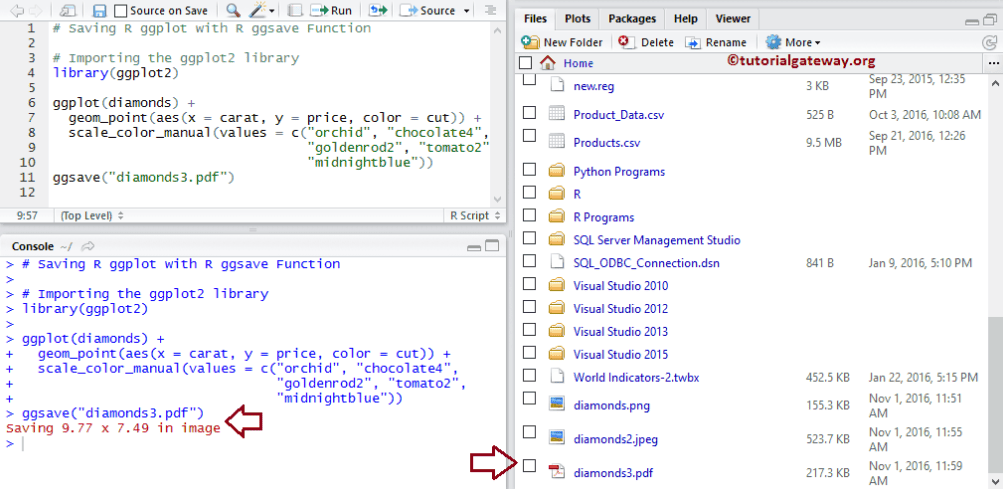
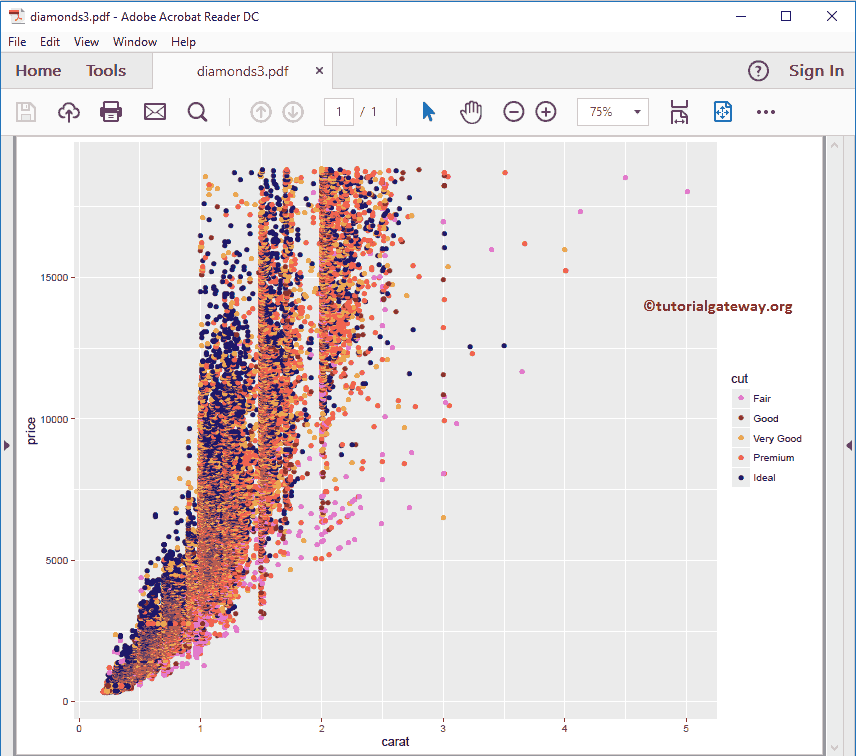
让我们打开diamonds.pdf文件看看
使用ggsave指定宽度和高度保存R ggplot图表
ggsave函数还允许我们使用width和Height参数来指定图像的宽度和高度。
# Importing the ggplot2 library
library(ggplot2)

ggplot(diamonds) +
  geom_point(aes(x = carat, y = price, color = cut)) +
  scale_color_manual(values = c("orchid", "chocolate4",
                                "goldenrod2", "tomato2",
                                "midnightblue"))
ggsave("diamonds4.png",
       width = 30, height = 20, units = "cm")
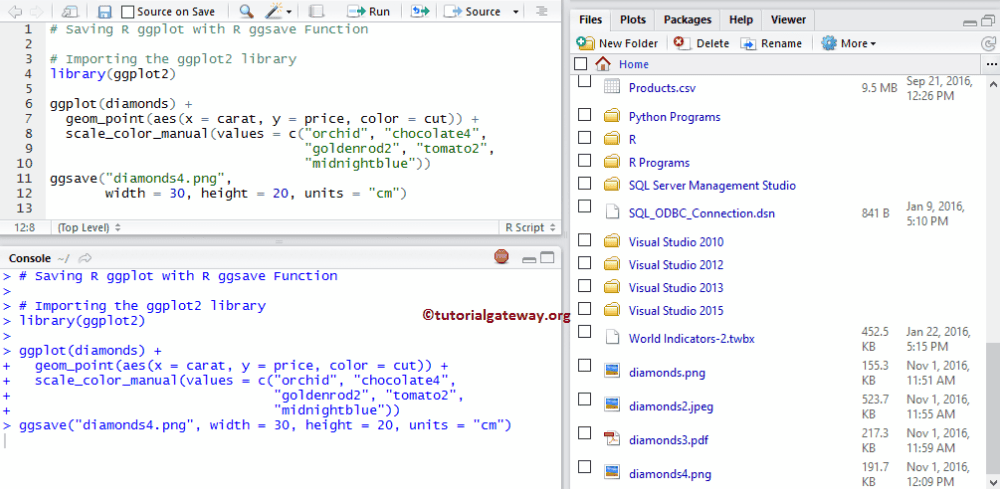
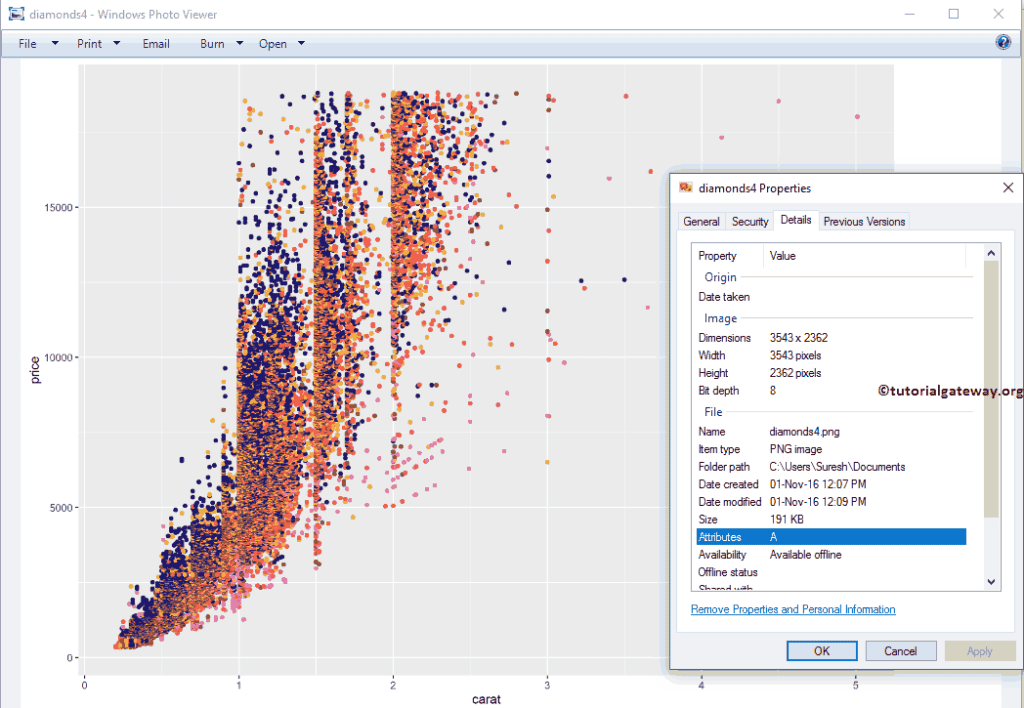
让我们打开diamonds4.png文件看看
使用导出功能将ggplot保存为图像
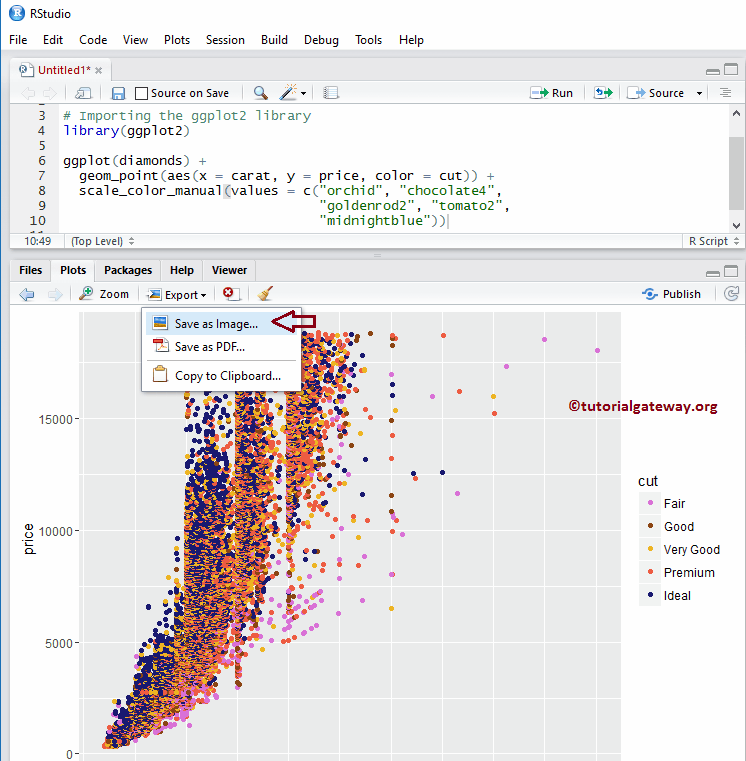
让我们看看如何使用传统方法保存ggplot。首先,在“绘图”选项卡下选择“导出”选项,然后选择“另存为图像…”选项。
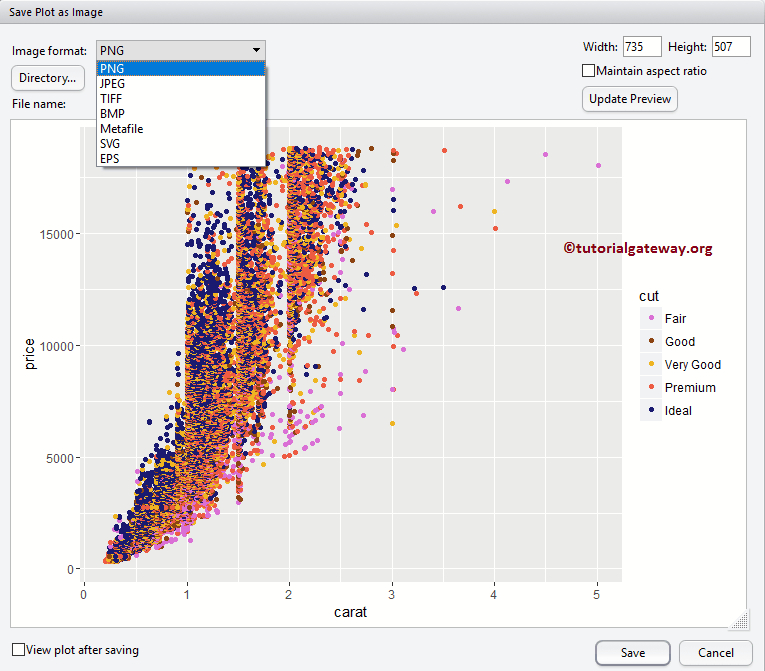
选择“另存为图像…”选项后,会弹出一个名为“另存为图像”的新窗口;请选择您希望保存的图像格式。
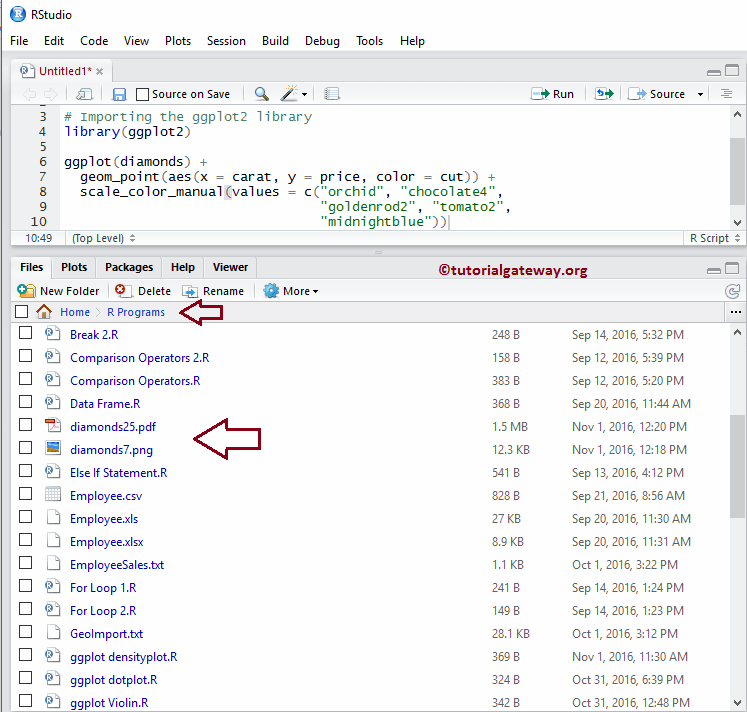
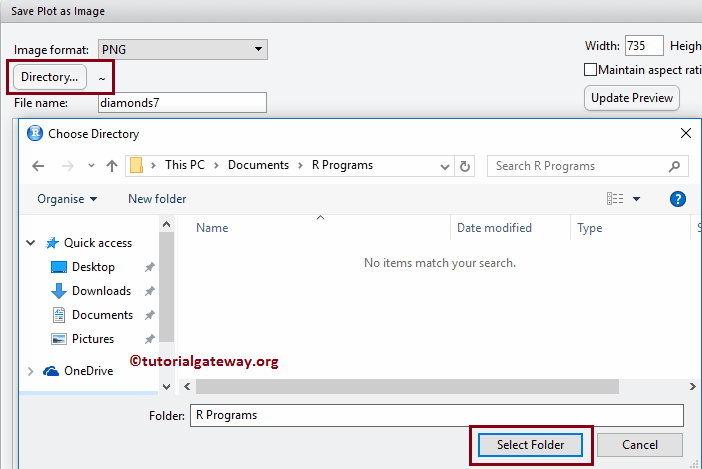
接下来,单击“目录”按钮选择要保存图像的文件目录或位置。从下面的截图可以看出,我们正在选择R Programs文件夹。
接下来,您可以更改图像的宽度和高度。
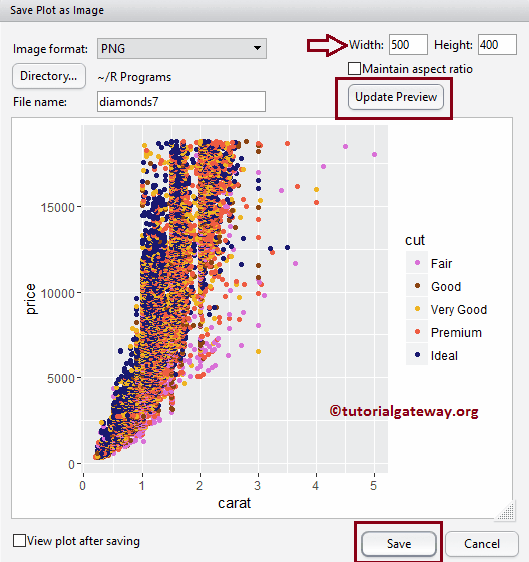
完成设置后,单击“保存”按钮将图像以相应格式保存。
使用导出功能将R ggplot保存为PDF
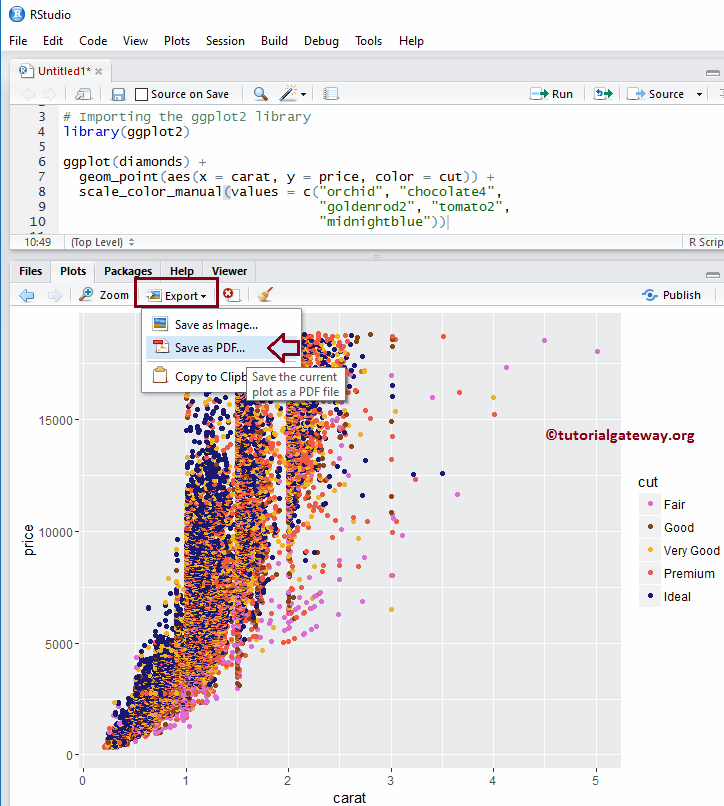
此示例展示了如何使用传统方法将ggplot保存为pdf。为此,请在“绘图”选项卡下选择“导出”选项,然后选择“另存为PDF…”选项。
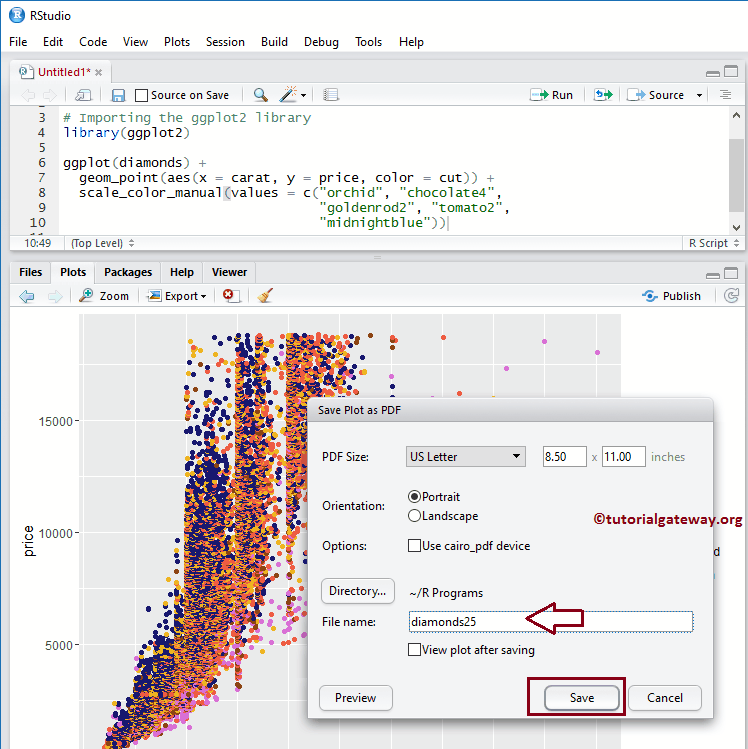
选择“另存为PDF…”选项后,会弹出一个名为“另存为PDF”的新窗口。请选择目录并更改pdf文件名。
从下面的截图可以看到新保存的png和pdf文件。