R ggplot2 抖动图对于处理由较小数据集离散性引起的过度绘图非常有用。让我们看看如何绘制 ggplot 抖动图,设置其颜色,更改标签,添加箱线图、小提琴图,并使用 ggplot2 包和示例更改图例位置。
在 R 语言中绘制 ggplot 抖动图的语法是
geom_jitter(data = NULL, width = NULL, height = NULL)
这个抖动图背后的复杂语法是
geom_jitter(mapping = NULL, data = NULL, stat = "identity",
            width = NULL, height = NULL, position = "jitter", ...,
            na.rm = FALSE, show.legend = NA, inherit.aes = TRUE)
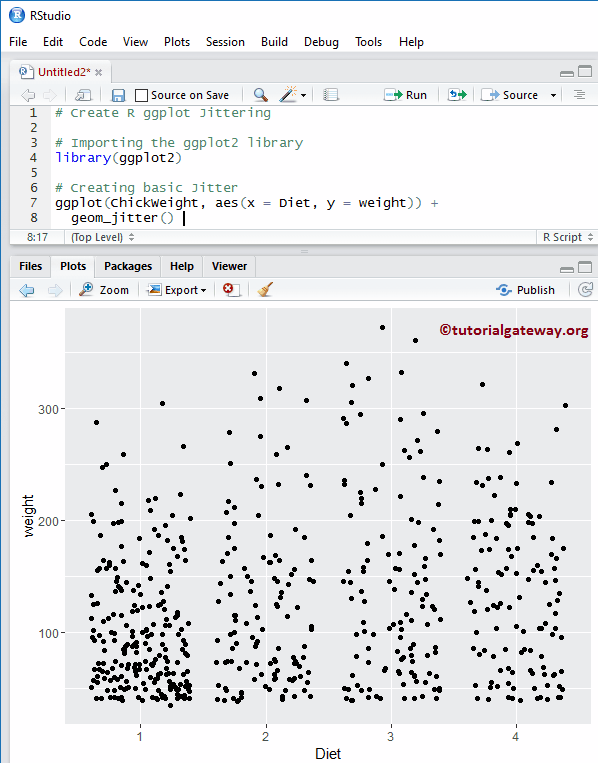
创建 R ggplot2 抖动图
让我们看看如何使用 ggplot2 包绘制抖动图,我们将使用 Studio 提供的 ChickWeight 数据集。
提示:ggplot2 包默认不安装。请参考 安装 R 包 文章,在 R 编程 中安装该包。
# Importing the ggplot2 library
library(ggplot2)

# Creating basic Jitter
ggplot(ChickWeight, aes(x = Diet, y = weight)) +
  geom_jitter()
注意:如果您需要从外部文件导入数据,请参考 R 读取 CSV 文章导入 CSV 文件。
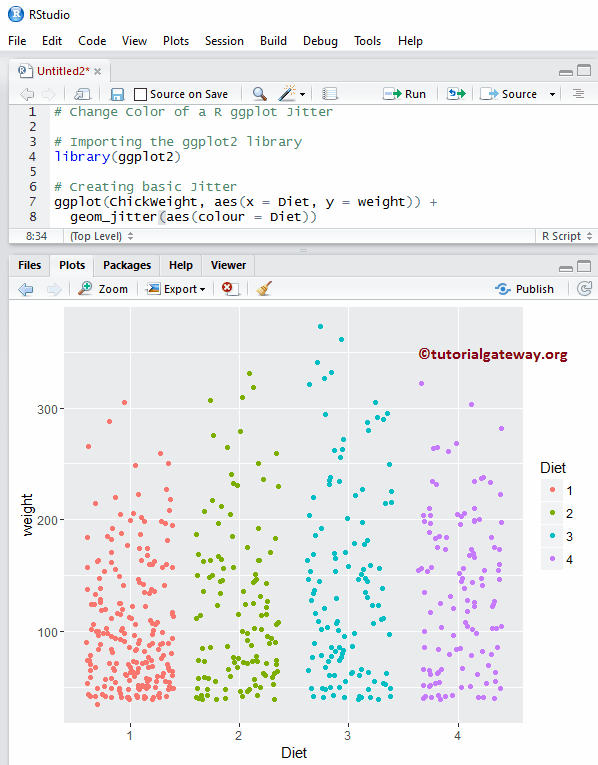
更改 R 中抖动图的颜色
让我们看看如何使用 color 参数更改抖动图的点颜色。
# Change Color of a Jitter

# Importing the ggplot2 library
library(ggplot2)

# Creating basic Jitter
ggplot(ChickWeight, aes(x = Diet, y = weight)) +
  geom_jitter(aes(colour = Diet))
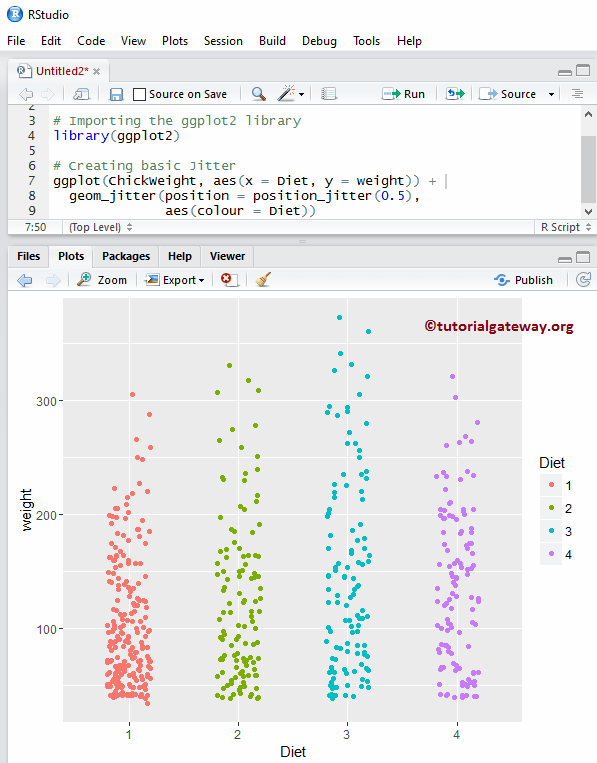
ggplot2 抖动图中的位置调整
在这里,我们展示了如何使用 position 参数调整点的位置。
# Position adjustment of a Jitter

# Importing the ggplot2 library
library(ggplot2)

# Creating basic Jitter
ggplot(ChickWeight, aes(x = Diet, y = weight)) +
  geom_jitter(position = position_jitter(0.5),
              aes(colour = Diet))
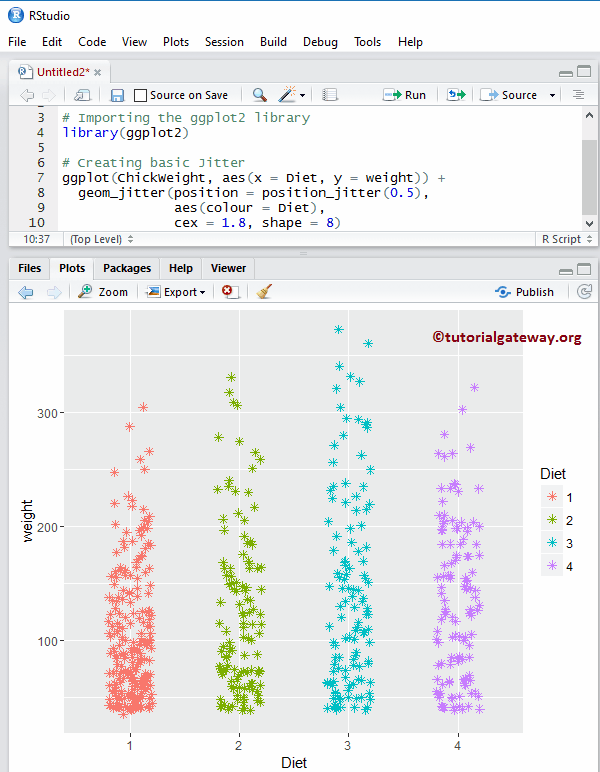
更改 R ggplot2 抖动图中点的大小和形状
如何使用 cex 参数更改表示点的字符大小,以及使用 shape 参数更改字符形状。
- cex:请指定点的大小。
# Change Shape & Size of a Point in a ggplot Jitter

# Importing the ggplot2 library
library(ggplot2)

# Creating basic Jitter
ggplot(ChickWeight, aes(x = Diet, y = weight)) +
  geom_jitter(position = position_jitter(0.5),
              aes(colour = Diet),
              cex = 1.8, shape = 8)
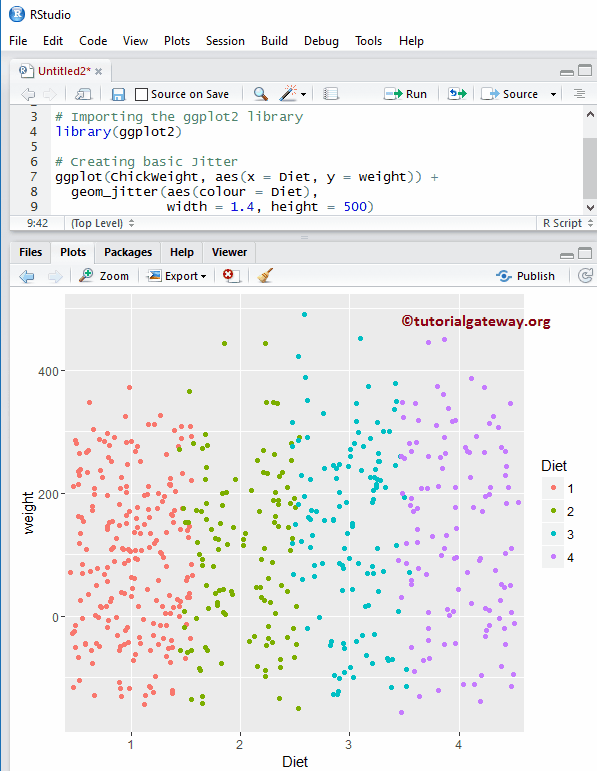
更改 ggplot2 抖动图的宽度和高度
在此示例中,我们展示了如何更改抖动图的宽度和高度。
# Change Width & Height of a Jitter

# Importing the ggplot2 library
library(ggplot2)

# Creating basic Jitter
ggplot(ChickWeight, aes(x = Diet, y = weight)) +
  geom_jitter(aes(colour = Diet),
              width = 1.4, height = 500)
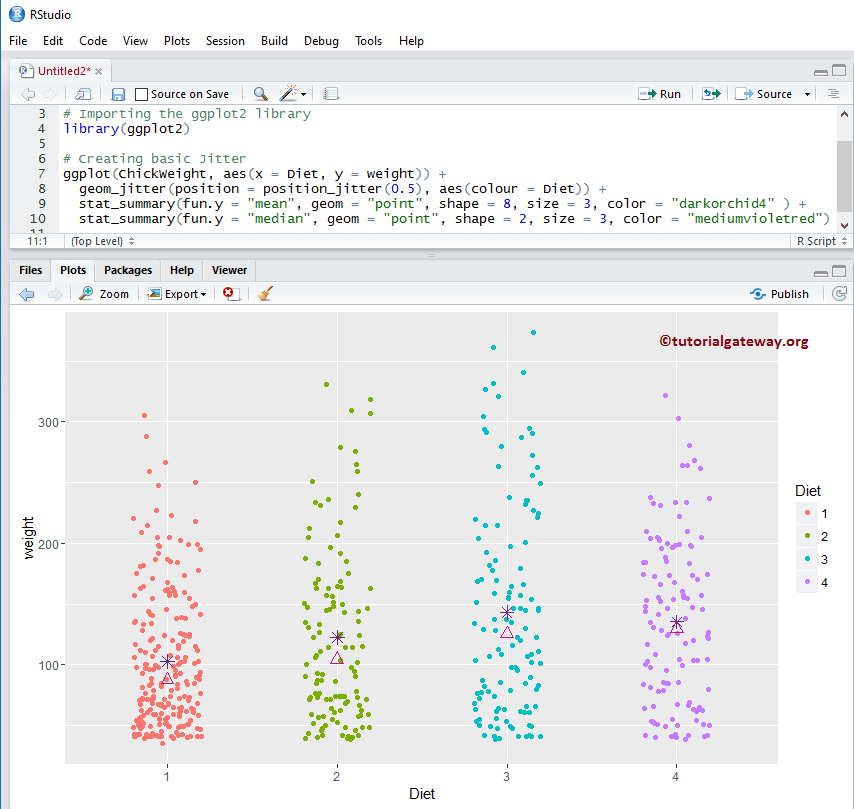
向 R ggplot2 抖动图添加均值和中位数
让我们看看如何使用 stat_summary 函数向 ggplot2 抖动图添加均值和中位数。
# Add Mean & Median to R ggplot Jitter

# Importing the ggplot2 library
library(ggplot2)

# Creating basic Jitter
ggplot(ChickWeight, aes(x = Diet, y = weight)) +
  geom_jitter(position = position_jitter(0.5), aes(colour = Diet)) +
  stat_summary(fun.y = "mean", geom = "point",
               shape = 8, size = 3, color = "darkorchid4" ) +
  stat_summary(fun.y = "median", geom = "point",
               shape = 2, size = 3, color = "mediumvioletred")
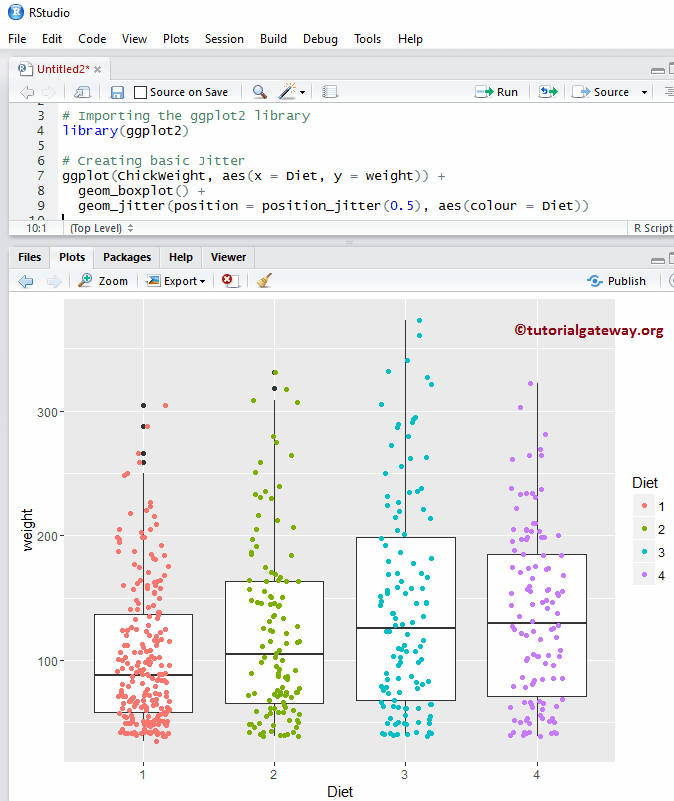
向 ggplot2 抖动图添加箱线图
在此示例中,我们使用 geom_boxplot 函数向 R 抖动图添加箱线图。这有助于我们查看中位数以及小提琴图的四分位数。
提示:请参考 R ggplot2 箱线图 文章了解箱线图的参数。
# Add Boxplot to Jitter

# Importing the ggplot2 library
library(ggplot2)

# Creating basic Jitter
ggplot(ChickWeight, aes(x = Diet, y = weight)) +
  geom_boxplot() +
  geom_jitter(position = position_jitter(0.5), aes(colour = Diet))
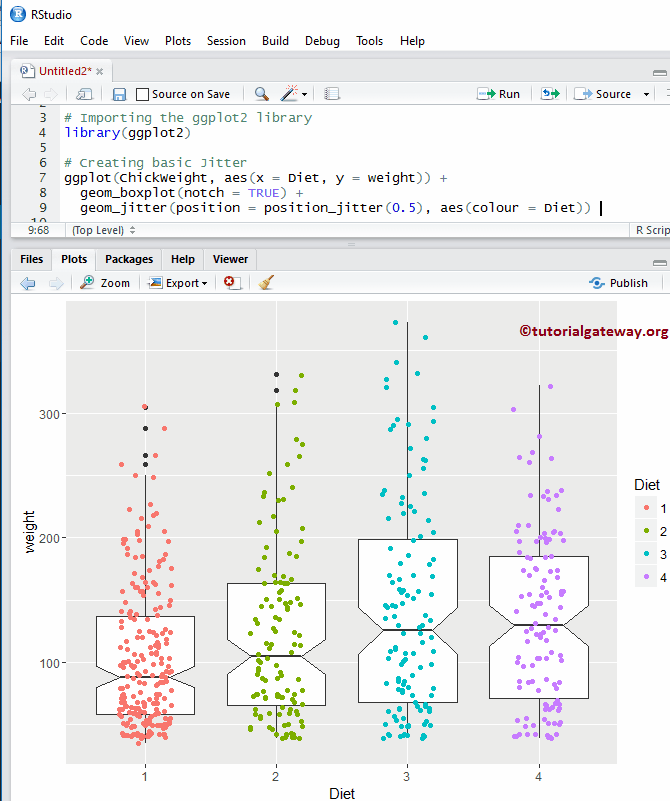
向 ggplot2 抖动图添加箱线图 2
在此示例中,我们使用 notch 参数在箱子的每一侧绘制一条线。
# Add Boxplot to Jitter

# Importing the ggplot2 library
library(ggplot2)

# Creating basic Jitter
ggplot(ChickWeight, aes(x = Diet, y = weight)) +
  geom_boxplot(notch = TRUE) +
  geom_jitter(position = position_jitter(0.5), aes(colour = Diet))
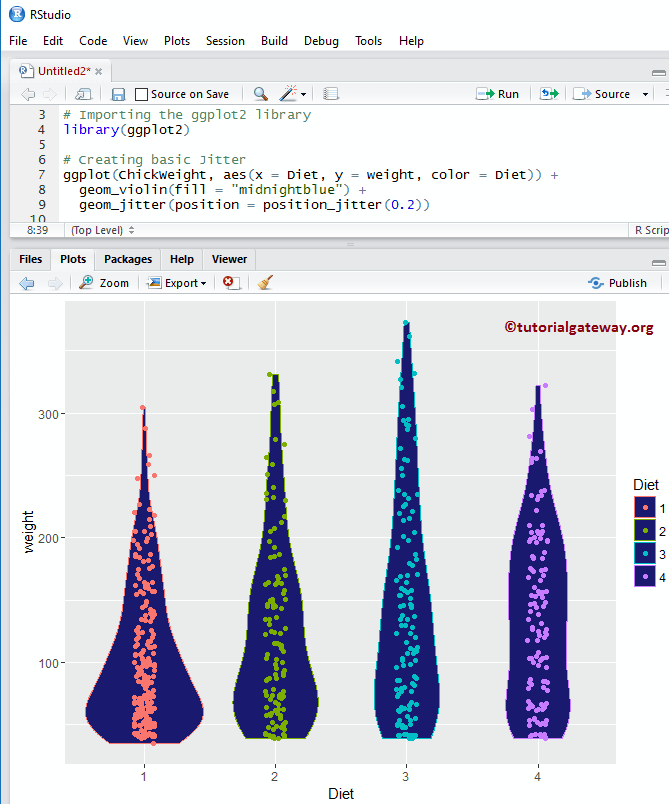
向 R ggplot2 抖动图添加小提琴图
在此示例中,我们展示了如何使用 geom_violin 函数向抖动图添加小提琴图。
提示:请参考 R ggplot2 小提琴图 文章了解小提琴图的参数。
# Add Violin Plot to Jitter

# Importing the ggplot2 library
library(ggplot2)

# Creating basic Jitter
ggplot(ChickWeight, aes(x = Diet, y = weight, color = Diet)) +
  geom_violin(fill = "midnightblue") +
  geom_jitter(position = position_jitter(0.2))
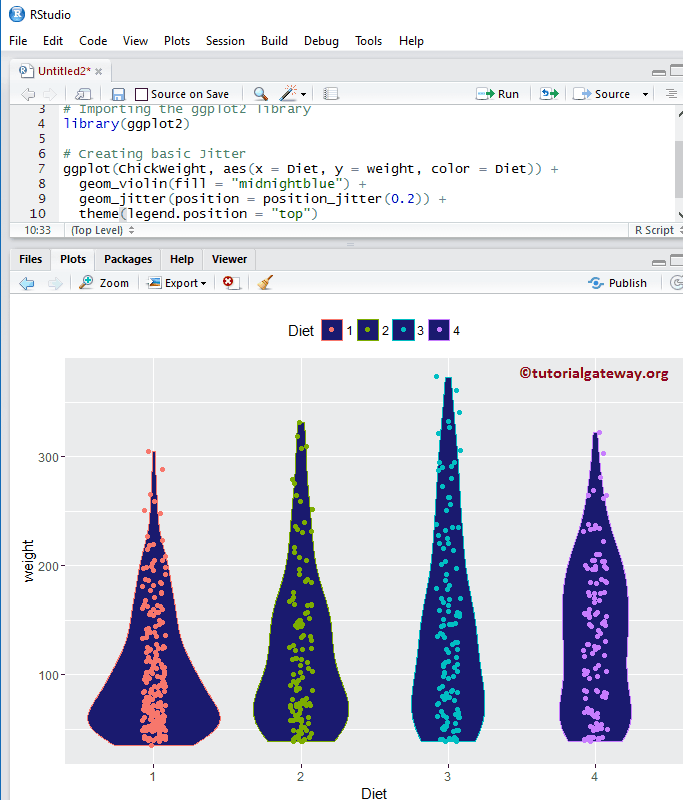
更改 ggplot2 抖动图图例位置
默认情况下,ggplot 将图例放置在抖动图的右侧。让我们看看如何将图例位置从右侧更改为顶部。注意,您可以使用 legend.position = “none” 完全删除图例。
# Alter Legend Position in Jitter

# Importing the ggplot2 library
library(ggplot2)

# Creating basic Jitter
ggplot(ChickWeight, aes(x = Diet, y = weight, color = Diet)) +
  geom_violin(fill = "midnightblue") +
  geom_jitter(position = position_jitter(0.2)) +
  theme(legend.position = "top")
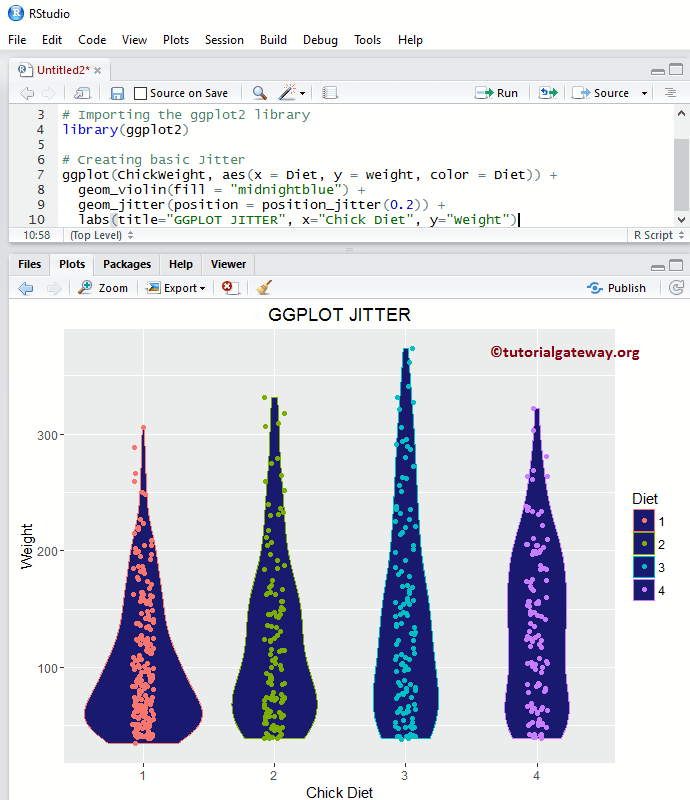
为 ggplot2 抖动图分配名称
如何使用 labs 函数为 ggplot 抖动图、X 轴和 Y 轴分配名称?
# Alter Legend Position

# Importing the ggplot2 library
library(ggplot2)

# Creating basic Jitter
ggplot(ChickWeight, aes(x = Diet, y = weight, color = Diet)) +
  geom_violin(fill = "midnightblue") +
  geom_jitter(position = position_jitter(0.2)) +
  theme(legend.position = "top")
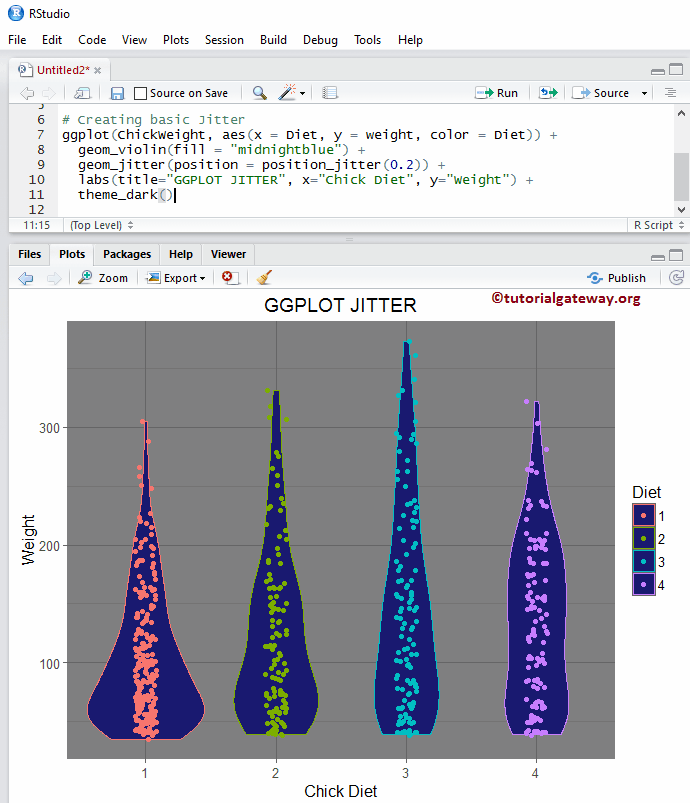
更改 R ggplot2 抖动图主题
在此示例中,我们展示了如何更改 ggplot 抖动图的默认主题。
- theme_dark():我们使用此函数将抖动图的默认主题更改为深色。如果您输入 theme_,则 R Studio 的智能感知将显示可用选项的列表。例如,theme_grey()。
# Change the Theme of a Jitter

# Importing the ggplot2 library
library(ggplot2)

# Creating basic Jitter
ggplot(ChickWeight, aes(x = Diet, y = weight, color = Diet)) +
  geom_violin(fill = "midnightblue") +
  geom_jitter(position = position_jitter(0.2)) +
  labs(title="GGPLOT JITTER", x="Chick Diet", y="Weight") +
  theme_dark()